
🤓 TL; DR
- Don’t skimp during the planning phase. Ensure that everyone on your team is aligned on the primary research purpose and their role in the project.
- Use methods that will result in data that can be easily analyzed and interpreted. Keep questions simple, and make predictions on how your sample may respond. These predictions will encourage your team to think about data analysis and potential insights.
- Know the limits of your team. What types of data are you best equipped to work with? Are there any out-of-the box analyses that your survey platform/research tool offers that you can leverage?
- Lean on a research panel for participant recruitment. We recommend Prolific!
- Use your data to tell a good story and recommend action rather than present an executive summary of the project’s findings.
Research Plan & Design
When conducting a research study of any scale, planning before executing is crucial. Start by answering these questions:
- What’s the purpose of the research? What and who will the research inform?
- What is the primary measure of interest?
- How will the data be analyzed? What data analysis tools and skillset does your team have access to?
- How will the research be presented?
The answers to these questions will inform action items at each stage of the process.
Research Purpose & Scope
A great guiding question when thinking about the purpose of your research project is: Why is this research important? It could be important because it will inform the next marketing campaign, or maybe it will inform how customer experience can be improved. It could help align brand values with a target audience, get a better understanding of the qualities that consumers currently associate with your brand, or help you to understand the values and behaviors of a new audience.
Decide with all project stakeholders what the ultimate goal of the research should be - and don’t skimp on this step. A clear purpose will guide all other aspects of the project and ultimately result in the most relevant and actionable data.
Once a research purpose has been decided, it’s time to outline the scope of the project. The project scope should include: expectations for methodology and survey design, guidelines for participant recruitment (including specifics of your desired audience), resources required for data analysis, and finally, the expected deliverable. Internal deadlines can be set at this stage, and each action item should be assigned to a team member.
Methodology
Methodology directly contributes to the success (or failure) of a research project. It is the cornerstone of good research. Part of developing strong methodology is understanding your key measures of interest, and these should tie back directly to the purpose of your project. Let’s say that the purpose of a research project is something like:
The purpose of the proposed research project is to understand current brand perception within GenZ consumers.
Using this purpose as our guide, we can identify that the key thing that we want to measure is brand perception. Next we need to think about how we can operationalize the key measure. Brand perception is actually a pretty complex construct. Many different factors (let’s call these “variables”) can contribute to consumers’ overall perception of a brand, and these variables can be measured in different ways. For example: brand familiarity, personal experience with the brand, others’ experience with the brand, and the brand’s public values are some variables that might impact overall brand perception. Additionally, there are different ways that each of those variables can be measured.
Because there will be different ways to think about and operationalize your key measure of interest, your team must decide what variables, questions and measurement methods are most interesting or important to your project. In practice, variables will inform the methodology, and the research methodologies available to you will inform how variables are measured.
In the sections that follow, we’re going to explore how to use online surveys to collect high-quality data, in the context of our brand perception study. For this example, we’ll choose 4-5 key variables that will provide an overall picture of how the brand is perceived by GenZ consumers, and use different survey question types to measure these variables.
Survey Design
When designing a survey the two biggest methodological decisions are the types of questions used and how questions are asked (note that the former may be constrained to the question types that your chosen survey platform offers).
The chart below provides some examples of how a brand perception survey could be designed within the Phonic survey platform, using a variety of question types and methods.
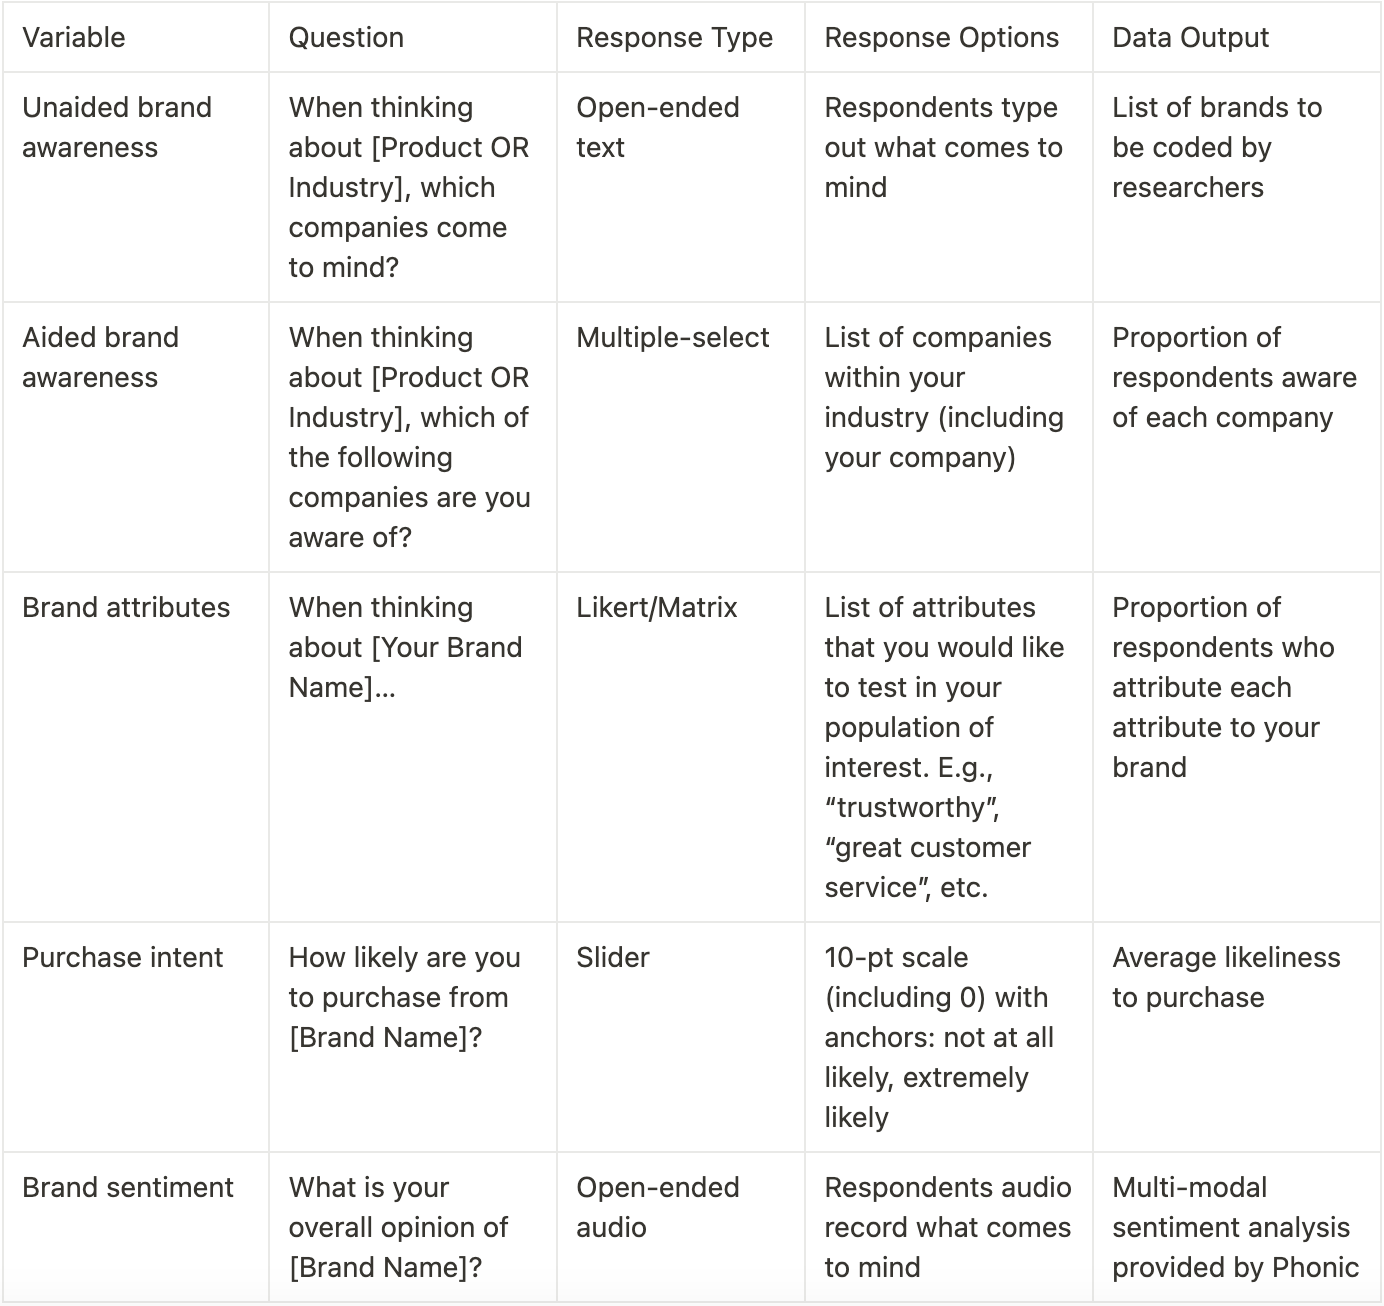
A note on open-ended audio responses. Audio responses within surveys are a fantastic way to collect qualitative data at a low cost. Phonic’s built-in multimodal sentiment analysis uses both what is said and how it is said to tag a response as positive, negative, neutral or mixed!
At this point in the process, you should start to have a general idea about how the data will be aggregated and analyzed (see last column in the chart above). If you anticipate that the data from a particular question will be difficult to interpret, then now is the time to make adjustments (e.g., change the question type, scrap the question, or alter the response options). Don’t bite off more than your team can chew - make sure that your methodology lends to a data analysis plan that matches the skillset of those on your team.
Execution
Now that most of the decisions have been made or discussed in the planning phase, it’s time to execute. Executing your project starts with bringing your survey design to life, finding the right respondents to take your survey, and finally, monitoring data as it rolls in!
Survey Programming
Survey programming brings those planned questions (that are most likely sitting in a Google doc), to life! How easy or difficult survey programming will be depends on your survey platform of choice (some are definitely more user-friendly than others), familiarity with the survey platform, and the complexity of your survey design. But, working out the design in the planning phase will decrease the amount of time needed in the survey builder.
Below is an example of the survey design outlined in the chart above, programmed in Phonic.
Surveys should be tested throughout programming. Before launching a survey to your audience, preview the survey and submit test data to ensure that everything is working as expected.
Recruiting Respondents
Now that your survey is programmed, who is going to take it? We recommend recruiting participants through a trusted panel provider, rather than sourcing participants individually or crowd sourcing participants on social media platforms. Individually sourcing participants requires a lot of manpower, while posting studies publicly (e.g., on social media) makes them susceptible to bots and scammers.
Our trusted panel provider is Prolific. Prolific guarantees high data quality, achievable through a rigorous vetting process and by offering participants fair compensation. All payments to participants are processed and handled by Prolific - making the process super easy for researchers! Check out some more information on how to use Prolific with Phonic, here.
How do you know you’re recruiting from your desired population?
Panel providers will typically have the ability to pre-screen participants such that only the desired audience is able to take your survey. For example, Prolific offers hundreds of screeners to choose from, including those that pertain to basic demographics (e.g., age), shopping habits and hobbies.
Deployment
Data collection is arguably the most stressful and exciting part of the research process. When your survey is live and collecting responses, the main task at hand is to monitor incoming responses and field any potential concerns or questions from respondents. Consistently checking-in on your data allows you to monitor data quality and confirm that data is coming in as-expected.
Once you achieve your full sample size, it’s time to aggregate and analyze the data, looking for patterns that will ultimately tell an interesting story and uncover actionable insights.
Insights & Actions
How data is best analyzed and presented depends on the type of data that it is. Below we outline how you might consider looking at and visualizing different types of data, and some tools that can help you out.
Data Analysis
Analyzing a data set can be daunting for anyone. Remember that the goal is to uncover meaningful patterns in how participants have responded to your questions. It is helpful at this stage to think back to your hypotheses and predictions; this will help guide where you might want to do a deep-dive.
When it comes to data analysis there are two main options: using the survey tool’s built-in data analytics and insights in the dashboard, or exporting the raw data to analyze “from scratch”. In both cases, patterns are discovered by aggregating data; rather than looking at individual-level responses, responses are analyzed at the group level.
Using the survey tool dashboard
Data analytics in the survey dashboard differ between survey tools. Most survey tools will aggregate data at the question level with simple visualizations. For example, tallying the number of respondents who selected “Trustworthy” as an attribute they associate with your brand, and displaying this count in a bar graph. Some tools will have flexible filtering such that these analytics change when a filter is applied (e.g., filtering for New Yorkers only).
In addition to simple data aggregations, some survey tools will offer more advanced analytics such as cross-tabs. Cross-tabs allow researchers to dive deeper into responses by visualizing the pattern of responses for one question, against the pattern of another question. For example, the proportion of respondents who selected “Trustworthy” as a brand attribute and selected “10” on their likeliness to purchase the product. This allows the researcher to make some more advanced inferences on how brand attributes may be related to likeliness to purchase.
Analyzing data from scratch
The first step when analyzing raw data is to clean the dataset. Cleaning a dataset typically consists of removing any respondents that do not “belong”. This may be participants who did not complete the entire survey, those who did not meet the audience criteria, or those who completed the survey too quickly (indicating that they might not have been paying attention).
Once unwanted respondents are removed, the data is ready to be aggregated at the question level. At this point, we recommend using distinct Excel sheets within a workbook for each question. This is simply a matter of copying all of the data for a particular question into a new data sheet. Note that demographic variables and session-level data (e.g., session or response IDs, date, gender, location, etc) should also be copied over, in the event that you would like to group the data by any of these variables.
Now we can use descriptive statistics (e.g., averages, medians, and proportions) to give us a picture of how the overall sample responded and how distinct groups (e.g., male vs. female) within the sample responded, to a particular question! For example, calculating the proportion of respondents who selected “Agree” when asked if your brand is trustworthy.
In some cases, the data for a question may be more complex than a list of response options. For example, when using a 5-pt Likert scale. One consideration for this type of data is to collapse different levels of responses. For example, grouping the data from the two highest scale points and calculating descriptive statistics with the new grouping.
A note on more advanced statistics… Some types of data require more advanced analytics than descriptive statistics. For example, if you want to test whether two distinct groups of participants differ significantly in their response patterns, then you would need to use inferential statistics to test the difference between the response distributions. These types of stats include z-tests, t-tests, Chi-Square tests, and others. Some of these tests are available through Excel formulas, and all are available through specialized statistical softwares such as R.
As you analyze the data, begin to think towards the future. How will this data be best presented to the project stakeholders? Data can usually be aggregated in different ways, and one way may be more impactful than another.
Discussing the Findings
Data is not just numbers and statistics. When data is looked at within the context of your project, you will see that these numbers and statistics begin to tell a story. And this story-telling is the ultimate goal of research. So where to begin?
Think back to the goal of your research and some of the predictions that your team set out during the planning phase. What measures were in-line with your predictions? Which surprised you? Were there measures that you thought would be interesting, but fell flat? It’s important to understand how each measure contributes to the big picture, and then use this framework to tell the story in a way that makes sense to your stakeholders.
For example, let’s say our GenZ audience was aware of our brand, but was unlikely to purchase. Looking at responses from the brand attributes question or brand sentiment open-ended question might help to understand why this is the case. Perhaps, GenZers perceive our brand as untrustworthy, and so even though they are aware of the brand, this does not lend to being more likely to purchase. This is the focus of the story, and as with all good stories, there is a conclusion: the brand must build greater trust with GenZers if they are to successfully sell to this audience.
Remember that you do not necessarily need to include all of the statistics in the final report. Sometimes our measures fall flat or are tough to interpret. Or our story has changed because another question yielded unexpected and interesting findings. Whatever the reason, if data doesn’t lend to the story, then ditch it for now.
You’re officially an honorary researcher!
Thanks for reading our guide to in-house survey research! Check out more discussions about research on the Phonic Blog.


